http://tuxgraphics.org/electronics

Temperature measurement and equipment control over the internet
![[Illustration]](../../common/images2/article09061/title.jpg)
Abstract:
Many people leave the heating in their home running all day
just because they are not sure when they would come home from work.
In summer it is probably the air condition that is running all day
and wasting energy.
We attach a couple of digital temperature sensors (maxim dallas 1-wire
sensors) to the tuxgraphics ethernet board and we can use that
not only to see the current temperature but also to plot temperature graphs
with 5 days of history. To do this an embedded web server is
running on the ethernet board along with drivers for the sensors.
A relay attached to the web server board can be use to remotely activate
the heating or air conditioning. When you are on the road you can
use your mobile phone, iphone, blackberry,... to see what is going on.
All that is done with a
tiny web server board based on the atmega168 or the atmega328 chip.
_________________ _________________ _________________
|
Temperature measurement and equipment control
The solution presented here allows you to attach one or two
temperature sensors to the board. You can also switch something on or off.
Something new in this software is the the possibility to plot graphs
of the measurement data.
This gives you measurement data
plots going back up to
5 days (or more, we are not at the limit of the microcontroller).
The graphs are conveniently displayed onto a web page provided by the avr
ethernet board. All the data is
stored on the microcontroller. The bar-plots which we use are drawn
with simple javascript functions.
To use this for control of heating or air conditioning is just a suggestion.
You can also use it to control ventilation in a green house or to control the
heating on the aquarium. It's up to you.
What is a 1-wire sensor?
1-wire sensors are produced by Maxim-IC
( http://www.maxim-ic.com/products/1-wire/ ) and they use a proprietary
single wire digital serial bus. In the extreme case you just need
ground (GND) and the data wire because some of the devices that they
have can be powered over the same wire where the data is sent. Normally one
would however use 3 wires: GND, power and signal. Those devices can be
used in a true bus structure because each of them gets a unique identity
number at production time. You can address them individually. They are reasonably robust with regards
to signal interference. The fact that there is only one signal wire between
two other wires shields the signal wire. I have used that
sensor with a 10m cable between ethernet board and sensor.
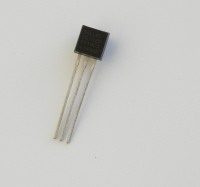
A good calibrated
digital temperature sensor is the DS18S20 and that is what we
will use here. With its TO-92 package it looks almost like a small signal
transistor.
In theory you can connect any number of those sensors and there is not
really any limitation in the software that would prevent you from doing
that. I found however that one or two sensors is a reasonable number.
The web pages and data structures are therefore prepared for up to two
sensors. If you want to have more sensors then you have to go yourself into
the code and change it.
You should keep the sensor at least 10cm (4 inch) away from the ethernet
board because the electronics on the board produces also a small amount of
heat.
Here is how to connect the sensor to the
microcontroller. The first sensor does not require any additional components
at all. For a second sensor I suggest to use an additional pull-up resistor
and a capacitor especially if that sensor is a few meters away. Those
additional components are there to improve the signal quality and reliability. It
will work without those but then you might get sometimes a sensor read
failure. The schematic shows also how to connect the relay which can
be used to switch something on or off.
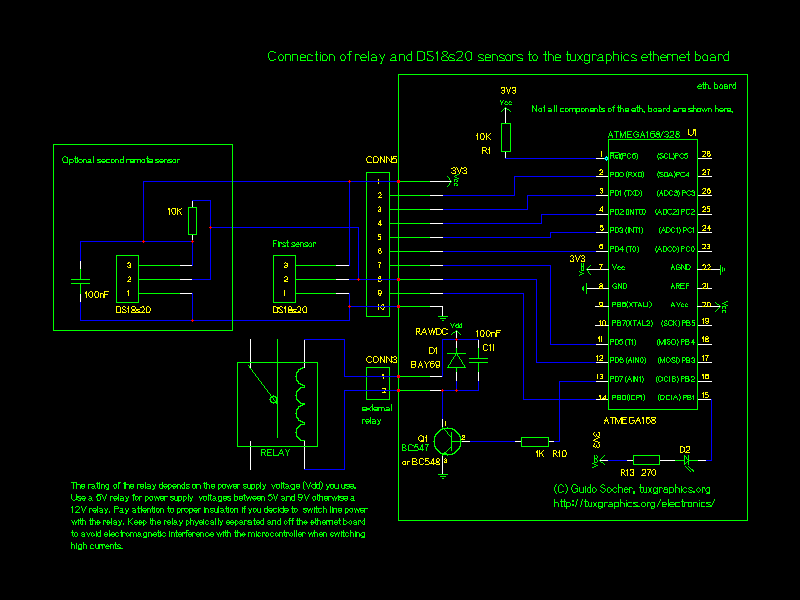
Click on the picture to view it as pdf file.
How to control the heating or air conditioning?
There are two main technologies for central heating systems. Water circulation
or air circulation. The hot air circulation is used frequently in north America because
one can
run the air conditioning through the same air ducts. Hot water
circulation is more efficient and provides a better sound insulation between the
rooms. It is the main technology used in Europe. It is also used if you have a solar
powered heating support system.
To power on or off the central heating completely is not such a good idea.
The same goes for central air conditioning.
Instead you should either
- attach to the control system of the heating/air
conditioning. It might have a switch where you can connect your relay in
parallel such that the system goes to standby
or
- you should switch on/off
the fan or pump that is responsible for the circulation
of the transport media (air or water).
You have to study a bit how the system in your house works and how this
can best be done. You can also first attach an ordinary switch and test what
happens before you run additional cables and insert the relay.
For smaller units such as a window mounted air conditioning system you
can of course just switch on/off the whole unit via a relay.
The switch/relay control dialog page.
You can either switch on/off
permanently or you can have it timer controlled.
The URL for the remote switch control page is implemented such that
you can bookmark it in your browser or mobile phone including also the
password string. This why
it is easy to use for everybody in the family. In your mobile phone you would
just select the bookmark for "switch on" and the relay at home would make
"click".
How to plot a graph?
Microcontrollers are really "micro". They are small, quite fast and
very energy efficient. The drawback is that they do not have
much memory. So we have to be very efficient in programming them.
I have experimented with many different ways of plotting and the best
solution turned out to be one based on javascript. In other words
we do most of the calculations in the web browser. The microcontroller
can then just provide the plot data. I have tested the javascript with
many different web browsers, even mobile phones, to be sure that it works
everywhere.
Here is an example on how this works. We call the function bp (for bar plot)
with the plot points and optional display strings as argument and then
the diagram is plotted inside the web browser.
The following function call to "bp" would result in the plot shown below.

bp(Array('small_10','twenty_20',30,40,35));
You can click on the picture to test this in your web browser.
Time is relative
Since we would like to plot the temperature over time we need
to add somehow the time to the diagram. There is a crystal
on the tuxgraphics avr ethernet board so we do have an accurate clock
signal. We could then just use that to implement a clock and the
user would have to set the time after power-up. We could also use
NTP since this board can be connected to the network.
There is a much simpler solution. All web browsers know what the
current local time is. Since we generate the web page with plot data
the moment the user clicks on it we can also just tell the web browser
how much offset there is between the last plot point and now. In other words
we just say "this sample was taken 10min ago" and the other was "2 hours and
10min ago", .... All we need is this relative time offset and there is
no need to configure any clock or time.
The graph shows the date, time and value (date-mm:hh=val).
Using the data elsewhere
Such a web page with temperature information is a very good user interface
but it is also a good API (machine interface). You can post process
a web page with some script and command line web browsers such as (w3m,
lynx and wget).
There is also a much simpler solution. We make a page that contains nothing
but the actual current temperature reading. Just a number. This can easily
be
included into other pages using PHP or alike. It can also
be very easily read by any TCP enabled application.
You can get to these "temperature only pages" by clicking on the numbers for
the current temperature readings:
Clicking on 23.4 would give you a page with just "23.4".
How to access my avr web server over the internet when I am not at home?
It is fairly easy to access this web server over the public internet e.g
via your iPhone. For this you
need a DSL router which supports "port forwarding" and works with
a dynamic dns service such as DynDNS (http://www.dyndns.com/services/dns/dyndns/).
Port forwarding is a feature that tells your DSL router to make a
network internal server available on the external side. If the DSL router gets from the internet a
connection request for port 80 (web) then it will forward that request
to one specific internal IP address. You can configure in the DSL router
which internal IP address that is. The avr web server is then connected to
your LAN at
this internal IP address.
If you want to read more about this then have a look at the
article "Using
the AVR microcontroller based web server".
On the road
Here is how it looks like on a mobile
phone:


Click on the screenshots for a more detailed view. Use your browser
back-button to return to this page.
Conclusions
I love those microcontrollers not only because they are small and versatile
but also because they force you to think before writing code. There is too
much bad and fat software out there. The software world would be a much
better place if more people would think how to write efficient code.
References/Download
© Guido Socher, tuxgraphics.org
2009-07-03, generated by tuxgrparser version 2.57